VP of Sales Interview Scorecard

TL;DR
This scorecard provides a structured, role-specific rubric to evaluate candidates for VP of Sales against the skills that drive predictable revenue growth. It helps interviewers make objective hiring decisions by scoring observable behaviors across strategy, execution, people, and cross-functional impact.
Who this scorecard is for
For hiring managers, executive interviewers, and senior recruiters leading a VP of Sales search. It is designed to align panel interviews and produce comparable scores for final hiring decisions.
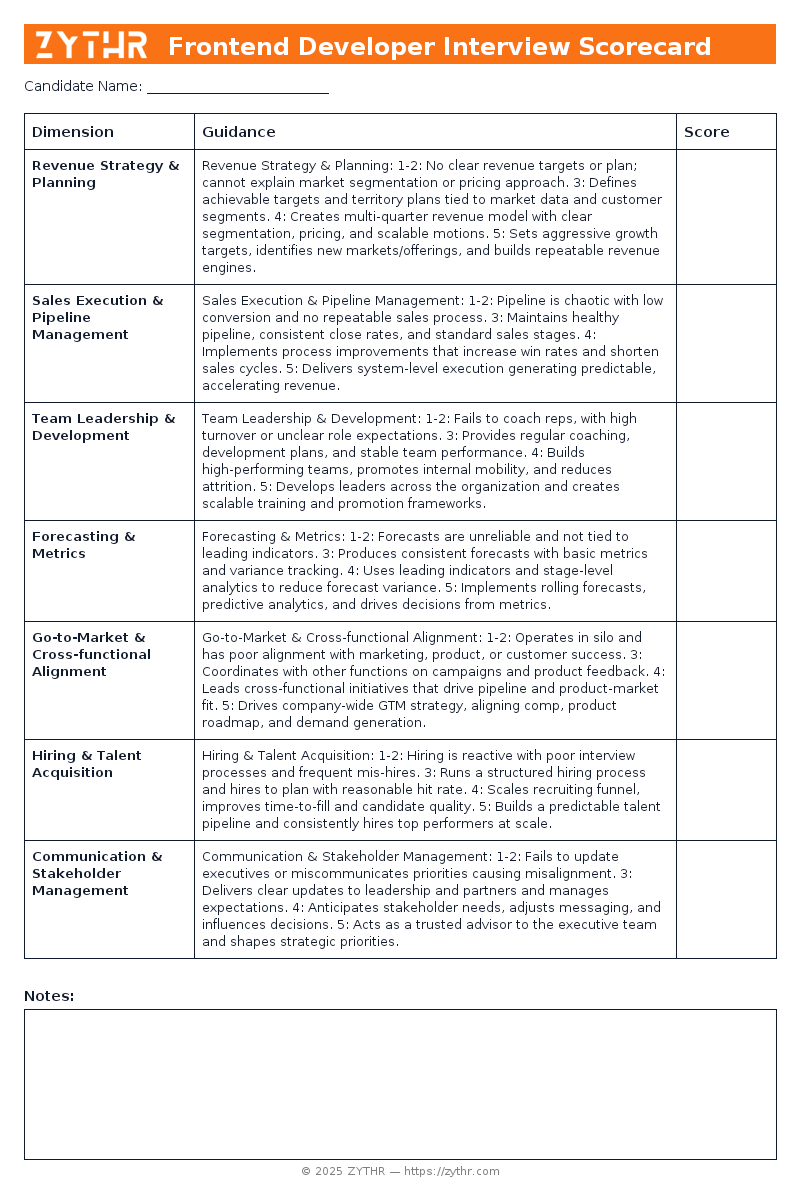
Preview the Scorecard
See what the VP of Sales Interview Scorecard looks like before you download it.

How to use and calibrate
- Pick the level (Junior, Mid, Senior, or Staff) and adjust anchor examples accordingly.
- Use the quick checklist during the call; fill the rubric within 30 minutes after.
- Or use ZYTHR to transcribe the interview and automatically fill in the scorecard live.
- Run monthly calibration with sample candidate answers to align expectations.
- Average across interviewers; avoid single-signal decisions.
Detailed rubric with anchor behaviors
Revenue Strategy & Planning
- 1–2: No clear revenue targets or plan; cannot explain market segmentation or pricing approach.
- 3: Defines achievable targets and territory plans tied to market data and customer segments.
- 4: Creates multi-quarter revenue model with clear segmentation, pricing, and scalable motions.
- 5: Sets aggressive growth targets, identifies new markets/offerings, and builds repeatable revenue engines.
Sales Execution & Pipeline Management
- 1–2: Pipeline is chaotic with low conversion and no repeatable sales process.
- 3: Maintains healthy pipeline, consistent close rates, and standard sales stages.
- 4: Implements process improvements that increase win rates and shorten sales cycles.
- 5: Delivers system-level execution generating predictable, accelerating revenue.
Team Leadership & Development
- 1–2: Fails to coach reps, with high turnover or unclear role expectations.
- 3: Provides regular coaching, development plans, and stable team performance.
- 4: Builds high-performing teams, promotes internal mobility, and reduces attrition.
- 5: Develops leaders across the organization and creates scalable training and promotion frameworks.
Forecasting & Metrics
- 1–2: Forecasts are unreliable and not tied to leading indicators.
- 3: Produces consistent forecasts with basic metrics and variance tracking.
- 4: Uses leading indicators and stage-level analytics to reduce forecast variance.
- 5: Implements rolling forecasts, predictive analytics, and drives decisions from metrics.
Go-to-Market & Cross-functional Alignment
- 1–2: Operates in silo and has poor alignment with marketing, product, or customer success.
- 3: Coordinates with other functions on campaigns and product feedback.
- 4: Leads cross-functional initiatives that drive pipeline and product-market fit.
- 5: Drives company-wide GTM strategy, aligning comp, product roadmap, and demand generation.
Hiring & Talent Acquisition
- 1–2: Hiring is reactive with poor interview processes and frequent mis-hires.
- 3: Runs a structured hiring process and hires to plan with reasonable hit rate.
- 4: Scales recruiting funnel, improves time-to-fill and candidate quality.
- 5: Builds a predictable talent pipeline and consistently hires top performers at scale.
Communication & Stakeholder Management
- 1–2: Fails to update executives or miscommunicates priorities causing misalignment.
- 3: Delivers clear updates to leadership and partners and manages expectations.
- 4: Anticipates stakeholder needs, adjusts messaging, and influences decisions.
- 5: Acts as a trusted advisor to the executive team and shapes strategic priorities.
Scoring and weighting
Default weights (adjust per role):
Dimension | Weight |
---|---|
Revenue Strategy & Planning | 20% |
Sales Execution & Pipeline Management | 18% |
Team Leadership & Development | 17% |
Forecasting & Metrics | 13% |
Go-to-Market & Cross-functional Alignment | 12% |
Hiring & Talent Acquisition | 10% |
Communication & Stakeholder Management | 10% |
Final score = weighted average across dimensions. Require at least two “4+” signals for Senior+ roles.
Complete Examples
VP of Sales Scorecard — Great Candidate
Dimension | Notes | Score (1–5) |
---|---|---|
Revenue Strategy & Planning | Presents a multi-year growth model and new market entry plan. | 5 |
Sales Execution & Pipeline Management | Shows evidence of materially improving win rates and shortening cycle times. | 5 |
Team Leadership & Development | Documents development of multiple promoted leaders and low attrition. | 5 |
Forecasting & Metrics | Demonstrates forecasting accuracy improvement and predictive models. | 5 |
Go-to-Market & Cross-functional Alignment | Led initiatives that materially increased pipeline through cross-functional work. | 5 |
Hiring & Talent Acquisition | Scale-hired multiple top performers and reduced time-to-fill. | 5 |
Communication & Stakeholder Management | Regularly influences executive decisions and shapes company priorities. | 5 |
VP of Sales Scorecard — Good Candidate
Dimension | Notes | Score (1–5) |
---|---|---|
Revenue Strategy & Planning | Presents a credible target and territory plan linked to data. | 3 |
Sales Execution & Pipeline Management | Describes consistent win rates and pipeline hygiene practices. | 3 |
Team Leadership & Development | Describes regular 1:1s, KPIs, and improved rep performance. | 3 |
Forecasting & Metrics | Provides regular forecasts with clear metric definitions. | 3 |
Go-to-Market & Cross-functional Alignment | Describes collaborative campaigns with marketing or product. | 3 |
Hiring & Talent Acquisition | Uses scorecards and structured interviews with decent conversion. | 3 |
Communication & Stakeholder Management | Presents concise regular reports and escalates issues appropriately. | 3 |
VP of Sales Scorecard — No-Fit Candidate
Dimension | Notes | Score (1–5) |
---|---|---|
Revenue Strategy & Planning | Cannot outline target revenue or go-to-market approach. | 1 |
Sales Execution & Pipeline Management | Cannot explain current pipeline health or conversion metrics. | 1 |
Team Leadership & Development | Offers little coaching history and had teams with chronic turnover. | 1 |
Forecasting & Metrics | Forecasts consistently miss targets and lack rationale. | 1 |
Go-to-Market & Cross-functional Alignment | Cannot cite examples of cross-functional projects. | 1 |
Hiring & Talent Acquisition | No repeatable hiring process and multiple mis-hires. | 1 |
Communication & Stakeholder Management | Provides infrequent or unclear updates to leadership. | 1 |
Recruiter FAQs about this scorecard
Q: Do scorecards actually reduce bias?
A: Yes—when you use the same questions, anchored rubrics, and require evidence-based notes.
Q: How many dimensions should we score?
A: Stick to 6–8 core dimensions. More than 10 dilutes signal.
Q: How do we calibrate interviewers?
A: Run monthly sessions with sample candidate answers and compare scores.
Q: How do we handle candidates who spike in one area but are weak elsewhere?
A: Use weighted average but define non-negotiables.
Q: How should we adapt this for Junior vs. Senior roles?
A: Keep dimensions the same but raise expectations for Senior+.
Q: Does this work for take-home or live coding?
A: Yes. Apply the same dimensions, but adjust scoring criteria for context.
Q: Where should results live?
A: Store structured scores and notes in your ATS or ZYTHR.
Q: What if interviewers disagree widely?
A: Require written evidence, reconcile in debrief, or add a follow-up interview.
Q: Can this template be reused for other roles?
A: Yes. Swap technical dimensions for role-specific ones, keep collaboration and communication.
Q: Can ZYTHR auto-populate the scorecard?
A: Yes. ZYTHR can transcribe interviews, tag signals, and live-populate the scorecard.
See Live Scorecards in Action
ZYTHR is not only a resume-screening took, it also automatically transcribes interviews and live-populates scorecards, giving your team a consistent view of every candidate in real time.