Try Free
InterviewSales Operations AnalystScorecardHiring

Sales Operations Analyst Interview Scorecard

ZYTHR Resources September 11, 2025

TL;DR

This scorecard provides a consistent framework to evaluate Sales Operations Analyst candidates across core technical skills and cross-functional collaboration. It helps interviewers score strengths, identify gaps, and compare candidates objectively.

Who this scorecard is for

For hiring managers, sales ops leaders, and interviewers responsible for hiring a Sales Operations Analyst. Useful for recruiters and interview panels to align expectations and make data-driven hiring decisions.

Preview the Scorecard

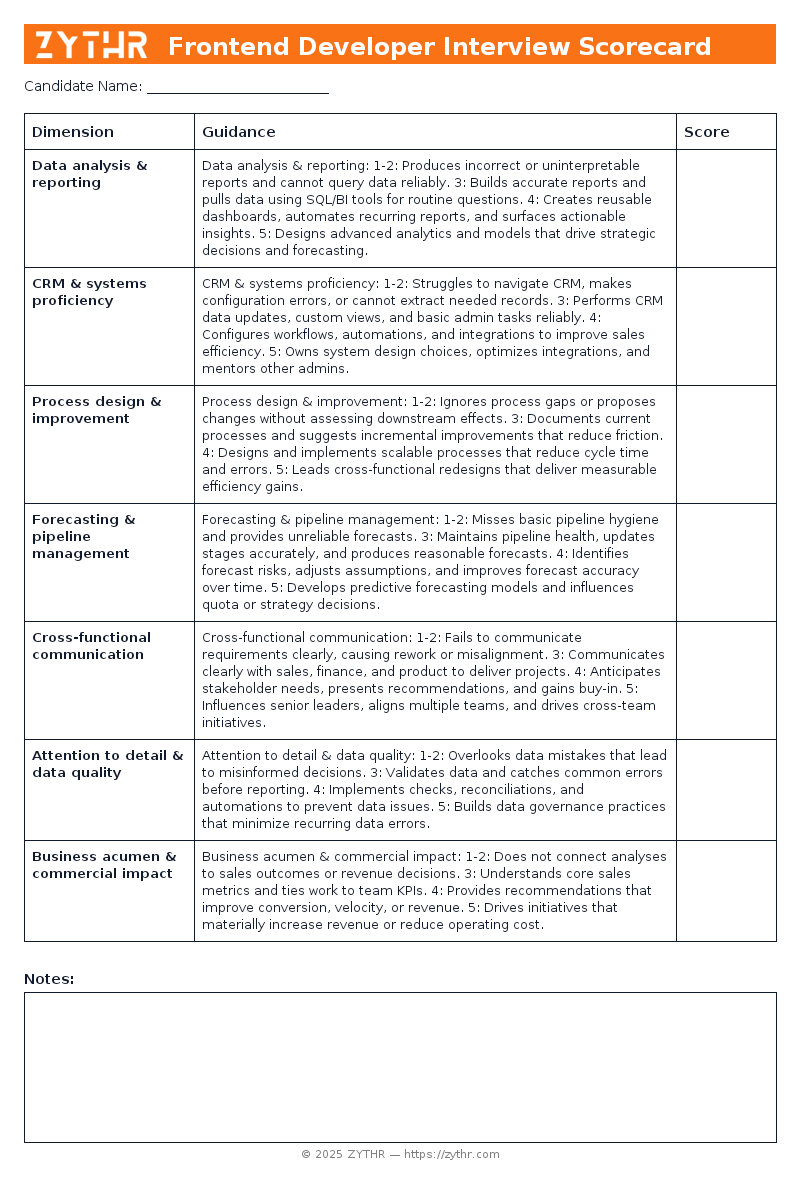
See what the Sales Operations Analyst Interview Scorecard looks like before you download it.

A ready-to-use Sales Operations Analyst Interview Scorecard template

Download the Scorecard

How to use and calibrate

  • Pick the level (Junior, Mid, Senior, or Staff) and adjust anchor examples accordingly.
  • Use the quick checklist during the call; fill the rubric within 30 minutes after.
  • Or use ZYTHR to transcribe the interview and automatically fill in the scorecard live.
  • Run monthly calibration with sample candidate answers to align expectations.
  • Average across interviewers; avoid single-signal decisions.

Detailed rubric with anchor behaviors

Data analysis & reporting

  • 1–2: Produces incorrect or uninterpretable reports and cannot query data reliably.
  • 3: Builds accurate reports and pulls data using SQL/BI tools for routine questions.
  • 4: Creates reusable dashboards, automates recurring reports, and surfaces actionable insights.
  • 5: Designs advanced analytics and models that drive strategic decisions and forecasting.

CRM & systems proficiency

  • 1–2: Struggles to navigate CRM, makes configuration errors, or cannot extract needed records.
  • 3: Performs CRM data updates, custom views, and basic admin tasks reliably.
  • 4: Configures workflows, automations, and integrations to improve sales efficiency.
  • 5: Owns system design choices, optimizes integrations, and mentors other admins.

Process design & improvement

  • 1–2: Ignores process gaps or proposes changes without assessing downstream effects.
  • 3: Documents current processes and suggests incremental improvements that reduce friction.
  • 4: Designs and implements scalable processes that reduce cycle time and errors.
  • 5: Leads cross-functional redesigns that deliver measurable efficiency gains.

Forecasting & pipeline management

  • 1–2: Misses basic pipeline hygiene and provides unreliable forecasts.
  • 3: Maintains pipeline health, updates stages accurately, and produces reasonable forecasts.
  • 4: Identifies forecast risks, adjusts assumptions, and improves forecast accuracy over time.
  • 5: Develops predictive forecasting models and influences quota or strategy decisions.

Cross-functional communication

  • 1–2: Fails to communicate requirements clearly, causing rework or misalignment.
  • 3: Communicates clearly with sales, finance, and product to deliver projects.
  • 4: Anticipates stakeholder needs, presents recommendations, and gains buy-in.
  • 5: Influences senior leaders, aligns multiple teams, and drives cross-team initiatives.

Attention to detail & data quality

  • 1–2: Overlooks data mistakes that lead to misinformed decisions.
  • 3: Validates data and catches common errors before reporting.
  • 4: Implements checks, reconciliations, and automations to prevent data issues.
  • 5: Builds data governance practices that minimize recurring data errors.

Business acumen & commercial impact

  • 1–2: Does not connect analyses to sales outcomes or revenue decisions.
  • 3: Understands core sales metrics and ties work to team KPIs.
  • 4: Provides recommendations that improve conversion, velocity, or revenue.
  • 5: Drives initiatives that materially increase revenue or reduce operating cost.

Scoring and weighting

Default weights (adjust per role):

Dimension Weight
Data analysis & reporting 20%
CRM & systems proficiency 18%
Process design & improvement 15%
Forecasting & pipeline management 15%
Cross-functional communication 12%
Attention to detail & data quality 10%
Business acumen & commercial impact 10%

Final score = weighted average across dimensions. Require at least two “4+” signals for Senior+ roles.

Complete Examples

Sales Operations Analyst Scorecard — Great Candidate

Dimension Notes Score (1–5)
Data analysis & reporting Dashboards drive weekly decisions and reduce ad-hoc requests 5
CRM & systems proficiency Implements automations that free reps' time 5
Process design & improvement Spearheads process redesigns that cut lead time significantly 5
Forecasting & pipeline management Forecasts accurately predict quarter outcomes and guide resource allocation 5
Cross-functional communication Persuades stakeholders to adopt operational changes 5
Attention to detail & data quality Establishes checks that prevent recurring data errors 5
Business acumen & commercial impact Leads projects that measurably increase revenue or reduce churn 5

Sales Operations Analyst Scorecard — Good Candidate

Dimension Notes Score (1–5)
Data analysis & reporting Regular reports are accurate and delivered on time 3
CRM & systems proficiency Configures reports and updates fields independently 3
Process design & improvement Creates clear process docs and implements small improvements 3
Forecasting & pipeline management Forecasts align with outcomes within expected variance 3
Cross-functional communication Delivers clear updates and aligns team expectations 3
Attention to detail & data quality Finds and fixes data issues during validation 3
Business acumen & commercial impact Links reports to quota attainment and conversion metrics 3

Sales Operations Analyst Scorecard — No-Fit Candidate

Dimension Notes Score (1–5)
Data analysis & reporting Reports contain errors or require constant correction 1
CRM & systems proficiency Cannot complete common CRM tasks without help 1
Process design & improvement Suggests changes that cause more work or confusion 1
Forecasting & pipeline management Forecasts frequently miss targets due to data issues 1
Cross-functional communication Misses key stakeholders or misstates requirements 1
Attention to detail & data quality Reports contain multiple unvalidated discrepancies 1
Business acumen & commercial impact Analyses lack link to revenue or KPIs 1

Recruiter FAQs about this scorecard

Q: Do scorecards actually reduce bias?

A: Yes—when you use the same questions, anchored rubrics, and require evidence-based notes.

Q: How many dimensions should we score?

A: Stick to 6–8 core dimensions. More than 10 dilutes signal.

Q: How do we calibrate interviewers?

A: Run monthly sessions with sample candidate answers and compare scores.

Q: How do we handle candidates who spike in one area but are weak elsewhere?

A: Use weighted average but define non-negotiables.

Q: How should we adapt this for Junior vs. Senior roles?

A: Keep dimensions the same but raise expectations for Senior+.

Q: Does this work for take-home or live coding?

A: Yes. Apply the same dimensions, but adjust scoring criteria for context.

Q: Where should results live?

A: Store structured scores and notes in your ATS or ZYTHR.

Q: What if interviewers disagree widely?

A: Require written evidence, reconcile in debrief, or add a follow-up interview.

Q: Can this template be reused for other roles?

A: Yes. Swap technical dimensions for role-specific ones, keep collaboration and communication.

Q: Can ZYTHR auto-populate the scorecard?

A: Yes. ZYTHR can transcribe interviews, tag signals, and live-populate the scorecard.

Download

Choose your format:

Share these templates with your hiring panel to keep everyone aligned.

See Live Scorecards in Action

ZYTHR is not only a resume-screening took, it also automatically transcribes interviews and live-populates scorecards, giving your team a consistent view of every candidate in real time.